Unit 1 · Introduction to Geography · Lesson 1.3 The Map Case · one idea at a time
We'll take this one idea at a time
GIS: Geographic Information Systems
GIS is computer geography. If a fact can be tied to a place, GIS can collect it, organize it, analyze it, and put it on a picture people can read. Old maps mostly got you from A to B. These maps can show crime, house prices, traffic, or whether an ambulance zone is actually covering its calls.
Finish the GIS definition: high-tech branch; collect, organize, analyze, and display spatially organized information.
Say what Landsat is, and name at least four ways GIS gets its data.
Give two real GIS examples from the lesson (emergency response, and one everyday use).
No rush. Next brings the next idea. Back always works. Your place is saved here.
If you want it
A running start
The letters look alike. Open this if those two still feel like the same word.
Not sure about the basics underneath this lesson?
GPS answers 'where am I?' GIS answers 'what happens in this place, and should we change the plan?' An ambulance GPS finds the house. GIS is how the county stacked 12,000 old calls to see whether the zones even make sense.
1
If it has a where, GIS can plot it
A traffic camera, a satellite picture, a store bar code with a shop address, a water-temperature sensor. A CD player has no where. That was the trap.
2
Landsat is the named satellite program
NASA. Earth-orbiting. Remote sensing. That is study-sheet question 2.
A phone shows you the route to the ER. Is that GIS, GPS, or both?
The blue dot and the turn-by-turn are GPS (plus a map). The system that stacked traffic, hospitals, and addresses to build that map is GIS. The lesson wants you to keep the words separate.
When this makes sense, hide it and go back to the lesson.
You can skip this and come back. Next goes into the lesson.
Lesson 1.3.6 p1 + p3 + Q11 of 3 in this idea
GIS in one sentence
The study sheet fill-in is the lesson's definition. Page 3 writes it in prose: GIS is a high-tech branch of geography that is relatively new. Experts use computers to organize, display, and analyze all forms of spatially organized information. The study sheet's version adds collect at the front of that list.
Lesson 1.3.6 p1 + p3 + Q12 of 3 in this idea
GIS in one sentence
So Q1 is: fast-paced, high-tech branch… collect, organize, analyze, and display all forms of spatially organized information.
Lesson 1.3.6 p1 + p3 + Q13 of 3 in this idea
GIS in one sentence
The opener story is an ambulance. Seconds matter. GIS makes pictures that help fire and police plan who covers which streets, and whether help can actually arrive in time. That is only part of what it can do.
0
Learn that definition word-for-word. High-tech. Analyze. Spatially organized. If a choice says GIS is just GPS on a phone, it is too small.
Not sure about this bit?
Three blanks on the study sheet. They are in page 3 if you look.
1
High-tech
The first blank. Not 'ancient.' Not 'paper.'
2
Analyze
Collect, organize, analyze, display. Analyze is the verb people skip.
3
Spatially organized
Two words. Tied to a location.
Quick check — answer out loud before you peek
Fill Q1 without looking.
High-tech; analyze; spatially organized.
When this makes sense, hide it and go back to the lesson.
Lesson 1.3.6 p21 of 3 in this idea
Layers: the EMS example
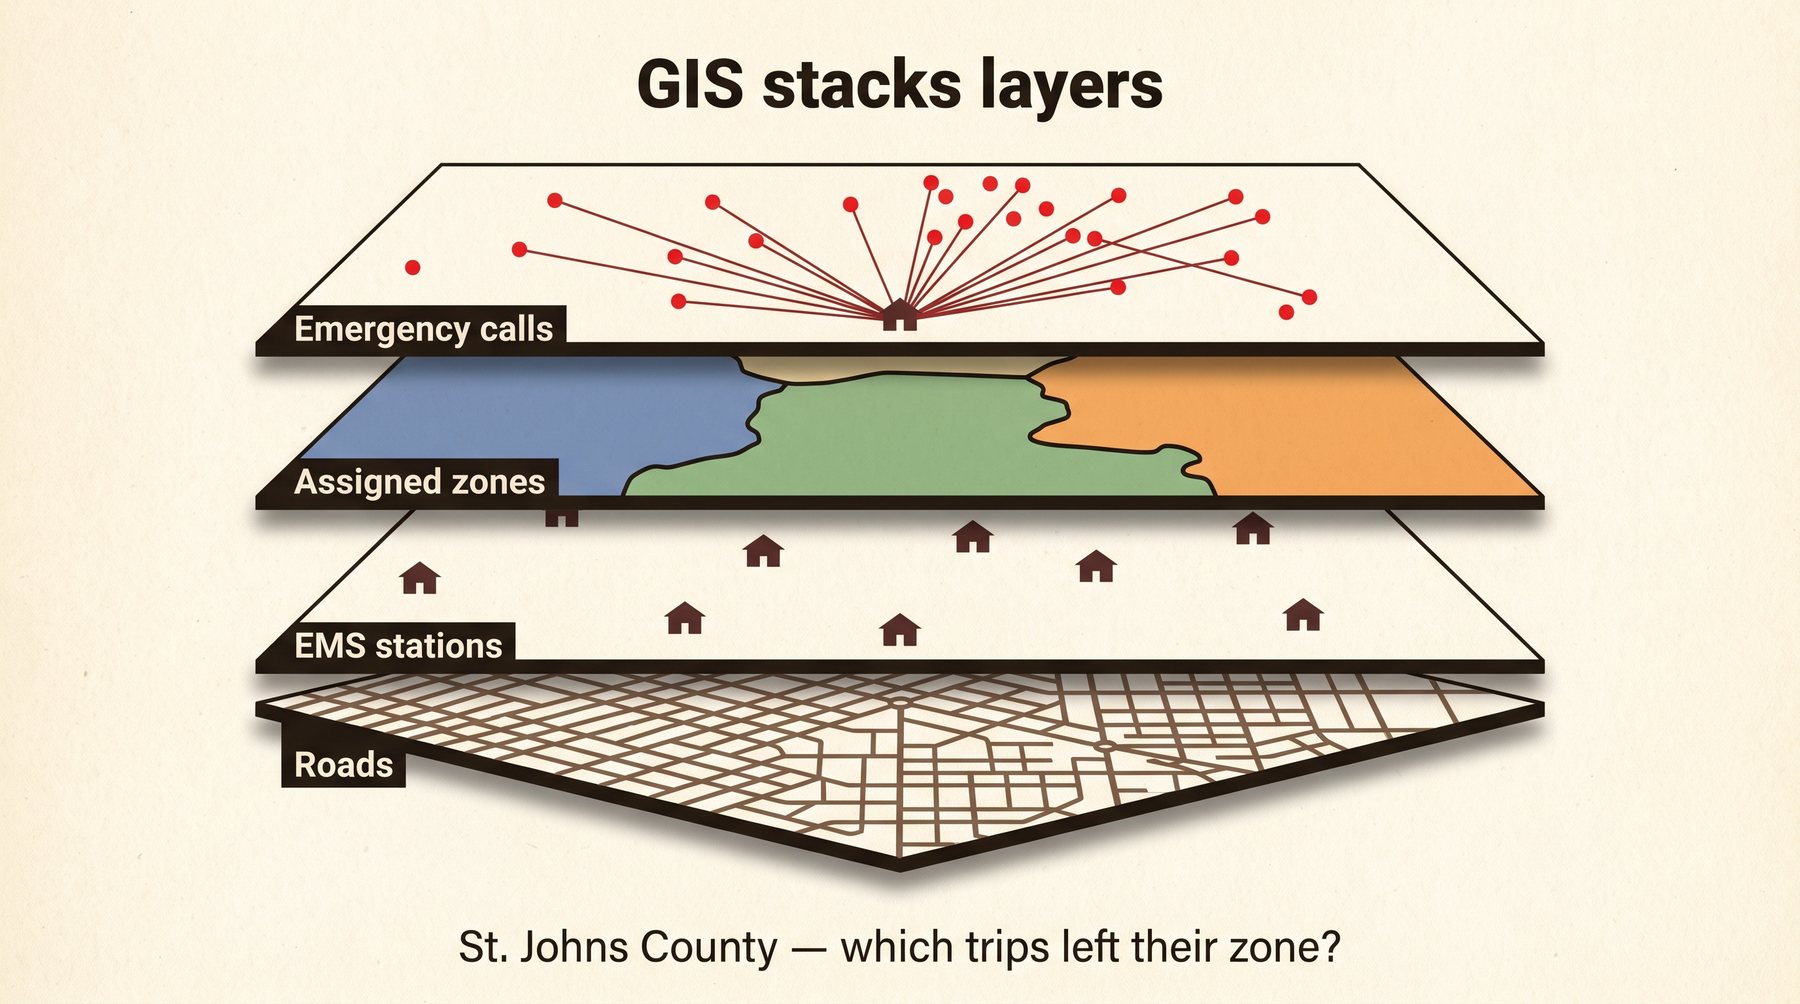
St. Johns County Fire Rescue Dispatch in Florida asked whether its EMS zones were working. GIS analysts stacked layers: 1. A road map of the county 2. Locations of EMS units (from addresses) 3. Each unit's assigned region, in color 4. A database of more than 12,000 emergency calls: address, call type, which unit went, travel time
Lesson 1.3.6 p22 of 3 in this idea
Layers: the EMS example
Each line of the spider diagram is one trip from a station to a call. That picture showed which responses landed inside the assigned zone and which did not. Officials could then decide whether to redraw zones or add units.
Lesson 1.3.6 p23 of 3 in this idea
Layers: the EMS example
The human eye is good at patterns. That is why a picture beats a spreadsheet for this decision.
GIS is layers. Roads, then stations, then zones, then the actual calls. The spider lines are the trips.
Click a diagram to open it bigger.
This is the lesson's worked example. If a question describes stacking roads, stations, and calls to fix ambulance coverage, the answer is GIS (layers / spider diagram).
Lesson 1.3.6 p3–4 + Q2–Q31 of 4 in this idea
Where the data comes from
Landsat is the named program: Earth-orbiting satellites that do remote sensing. NASA runs it. That is Q2.
Lesson 1.3.6 p3–4 + Q2–Q32 of 4 in this idea
Where the data comes from
Q3 asks for at least four technologies that gather data GIS can use. From page 3: • Traffic cameras over highways • Landsat satellites • Bar-code scanners in stores • Scanners that score standardized tests • Automated instruments that measure things like water temperature and air quality
Lesson 1.3.6 p3–4 + Q2–Q33 of 4 in this idea
Where the data comes from
Page 4 asked you to spot which devices collect spatially organized information. CD players were in that list as a trap. A CD player does not attach a where to a fact. GIS only works if the fact has a location.
Lesson 1.3.6 p3–4 + Q2–Q34 of 4 in this idea
Where the data comes from
The databases can be updated continuously. The software taps them and makes the picture.
0
Landsat = orbiting satellites, remote sensing, NASA. Four data sources: pick any four from cameras, Landsat, bar codes, test scanners, environmental instruments. Not a CD player.
Not sure about this bit?
Q2 is Landsat. Q3 is any four sources from the page.
1
Landsat
Orbiting satellites. Remote sensing. NASA.
2
Four others
Traffic cameras, bar-code scanners, test scanners, instruments that measure air or water. Not a CD player.
Quick check — answer out loud before you peek
Name Landsat in one sentence, then four data sources.
NASA Earth-orbiting remote-sensing satellites. Then any four from cameras, Landsat itself, bar codes, test scanners, environmental instruments.
When this makes sense, hide it and go back to the lesson.
Lesson 1.3.6 p6–7 + Q41 of 3 in this idea
Two examples, and what changed for mapmakers
Q4: give two examples of GIS in action. The lesson's own list is bigger than two. Strong pair: • Emergency response (the St. Johns EMS spider diagram, or getting paramedics to a baseball injury faster) • An everyday one: Dallas real-time traffic, Zillow house values using Landsat plus databases, GPS directions in a rental car, agriculture, banking, government services, scientific studies
Lesson 1.3.6 p6–7 + Q42 of 3 in this idea
Two examples, and what changed for mapmakers
Impact on cartography: maps used to focus on getting you from A to B. GIS maps can show much broader information, from demographics to crime rates.
Lesson 1.3.6 p6–7 + Q43 of 3 in this idea
Two examples, and what changed for mapmakers
You already use this. A phone map, a traffic site, a listing of nearby houses. That is geographic technology in daily life. GIS is the system behind stacking those facts on a place.
0
Two examples: one emergency-planning, one everyday (traffic, home values, phone directions). Do not give two that are both 'a map on a phone.'
That's the lesson
Before you quiz yourself
Check the ones that make sense now. This list is saved in this browser. The other tools (name that term, flashcards, practice quiz) are up top whenever you want them.
Built from Apex 1.3.6 (9 pages) and its study sheet. Fill-in blanks on Q1 were a snippet the library did not capture; the words come from the lesson prose on page 3. Page 4 (which devices collect spatial data), page 5, page 6, and the page 8 Scriptoid were not fully captured.