Unit 1 · Introduction to Geography · Lesson 1.3 The Map Case · one idea at a time
We'll take this one idea at a time
Maps and Map Bias
Every map leans. Bias is not always a bad word. It is what happens when someone chooses what to show, how to flatten the globe, and what to leave out. A map is valid when it does the job it was made for, not when it includes everything. Once you can name the lean, you can read the map instead of being pulled by it.
Define bias and explain why maps cannot avoid it.
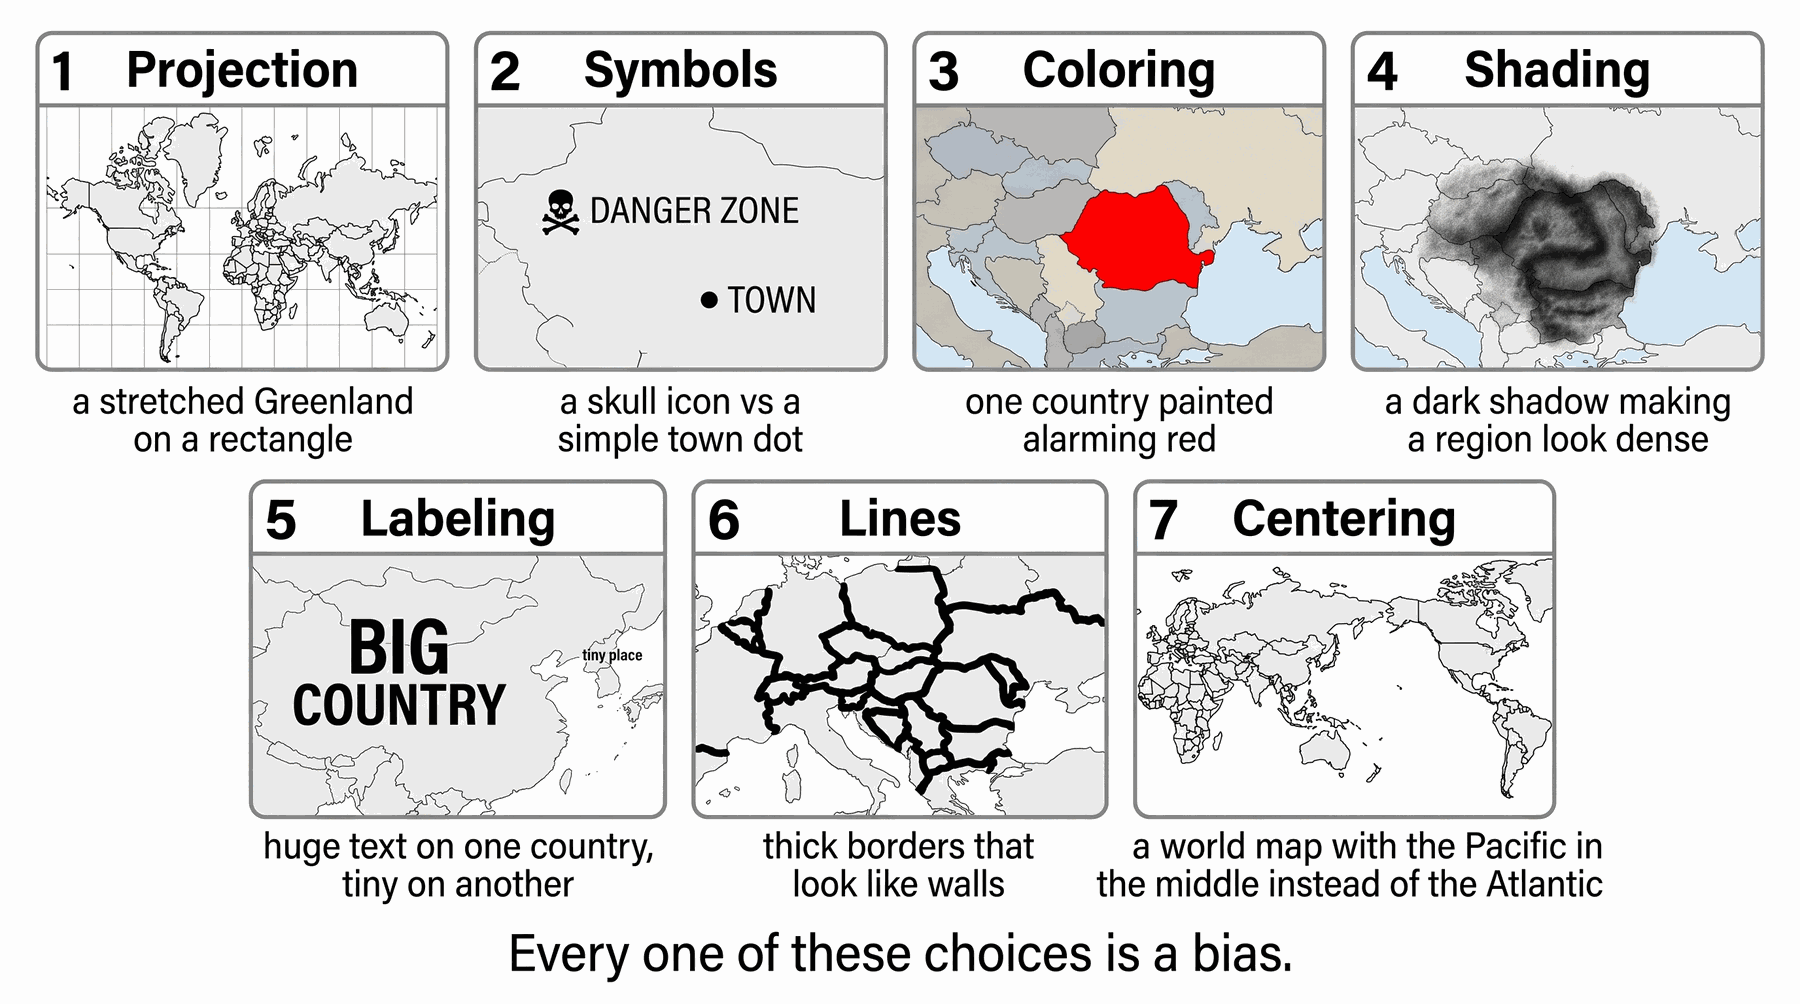
Describe how projection, symbols, color, shading, labels, lines, and centering can lean a map.
Judge a map by its purpose (validity), then plan a map of where you live with those choices made on purpose.
No rush. Next brings the next idea. Back always works. Your place is saved here.
If you want it
A running start
The word bias can sound like someone is lying. In this lesson it usually means someone had to choose. Open this if "every map is biased" still sounds like an accusation.
Not sure about the basics underneath this lesson?
You cannot copy the whole Earth onto one page. So a map is already a set of choices: what to put in the middle, what color to use, what to leave off. Those choices lean the picture one way. Sometimes the lean is unfair. Often it is just "I had one page." Validity is the other word: did the map do the job it claimed? A world map that is bad at finding a street is not broken. It is a world map.
1
Lean, not lie
Bias means a leaning. The course says it is not always a bad thing. A trail map that leaves off highway numbers leans toward hikers. That is the point of the map.
2
The dishwasher test
If a dishwasher runs every cycle and the dishes come out dirty, it failed its job. If a world map will not get you to James Street, you asked it to do the wrong job. Judge a map by what it was made to do.
3
Same votes, two pictures
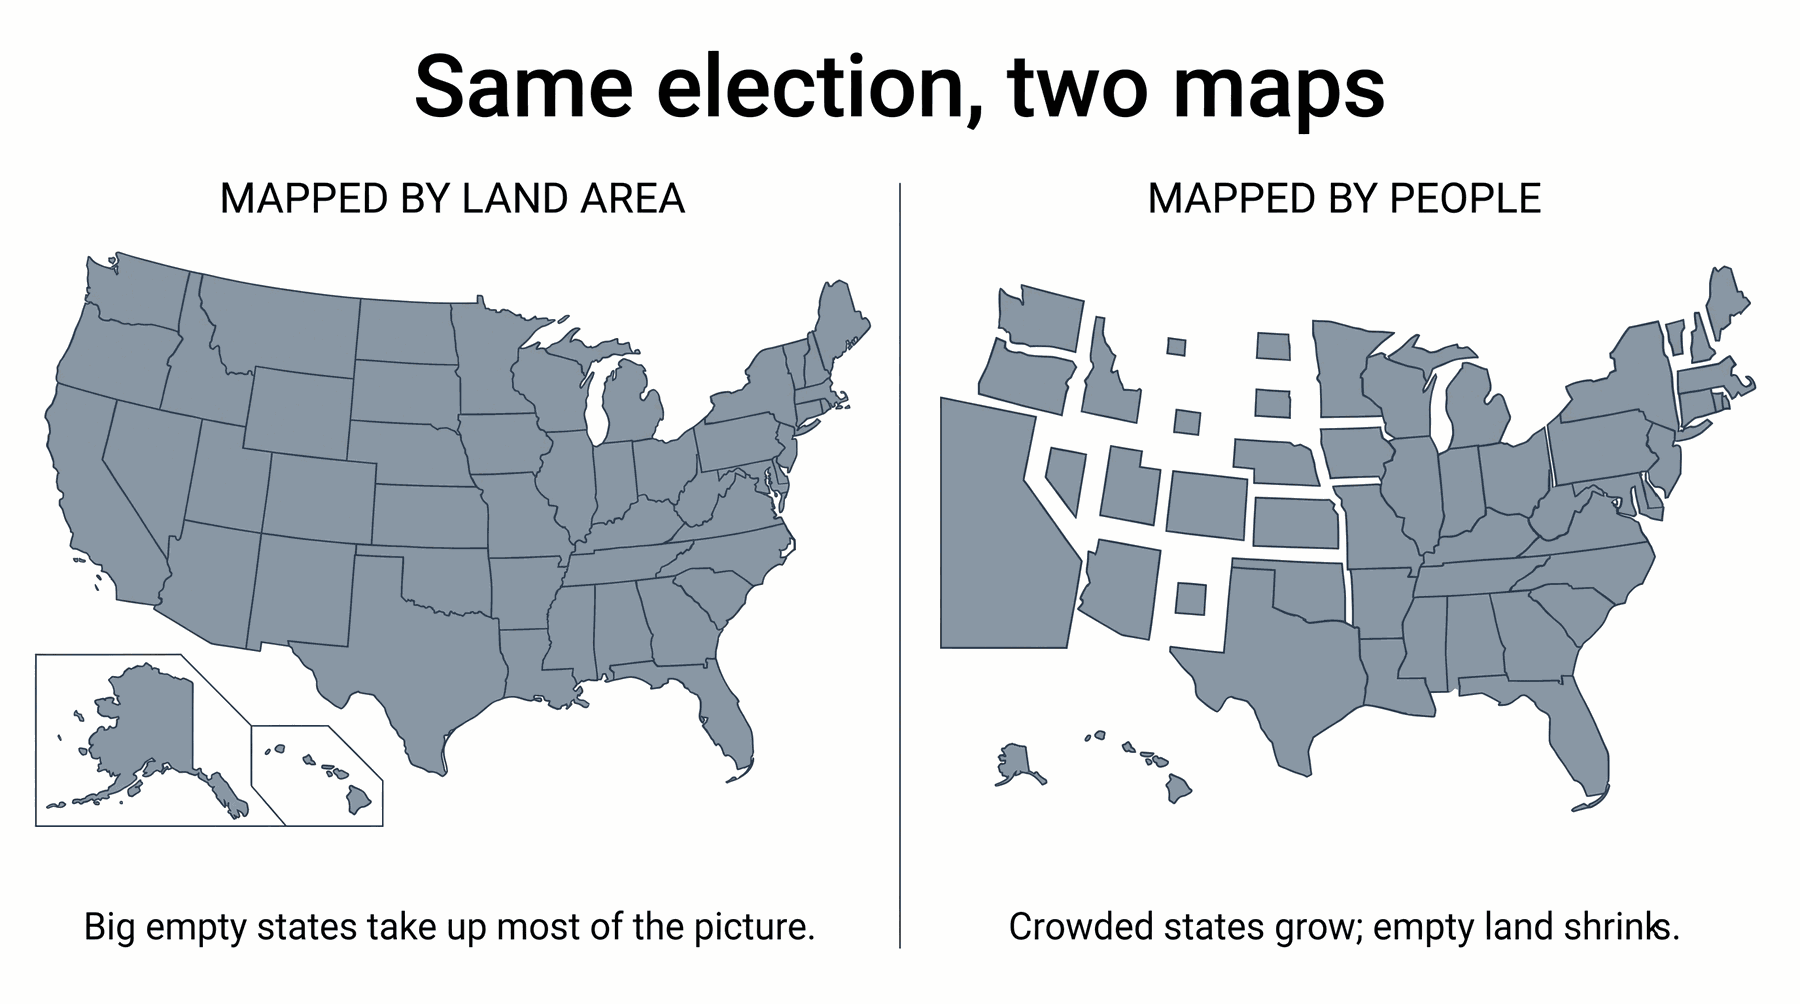
The 2004 election maps: color the land, and empty states look loud. Resize states by people, and the picture of who voted changes. Nobody changed the ballots. The map did.
Watch someone else explain it
Why every world map is wrong — TED-Ed — About five minutes. Shows that flattening the globe always stretches something, and that changing the picture changes how you see the world. That is this lesson's point about bias.
Quick check — answer out loud before you peek
A map of your town leaves off the next county and puts your house in the center. Is that wrong?
It is a lean: centering, and leaving things out. It is valid if the job was "a picture of my home." It is not valid if the job was "a county road atlas." Ask what the map was for first.
When this makes sense, hide it and go back to the lesson.
You can skip this and come back. Next goes into the lesson.
Lesson 1.3.5 p11 of 3 in this idea
Bias is a lean, not always a crime
Maps are visual communication, and every form of communication has a bias: a leaning in one direction or another. The lesson is careful. Bias can come from prejudice or from someone trying to trick you. It is not always a bad thing.
Lesson 1.3.5 p12 of 3 in this idea
Bias is a lean, not always a crime
Any picture of the world comes from a point of view and leaves something out. The world is too big to capture. For maps, the type, the projection, even the scale is a bias that always exists. You cannot avoid it. You still want to be able to name it.
Lesson 1.3.5 p13 of 3 in this idea
Bias is a lean, not always a crime
The lesson's famous example: maps of the 2004 U.S. presidential election. Same votes, different pictures, depending on whether you color land or people.
The lesson asks you to look at 2004 election maps and find the lean. Mapped by land area, big empty states dominate the picture. Mapped by people, the picture of who voted changes. Same election.
Click a diagram to open it bigger.
If a question says bias is always harmful, it is wrong. The course's definition is "a leaning," and it says it isn't always a bad thing.
Lesson 1.3.5 p21 of 2 in this idea
You cannot put the whole world on a page
A map at a scale of one inch to one inch would be the world itself, too big to use. So every map leaves out far more than it includes. Those include/exclude decisions are the bias.
Lesson 1.3.5 p22 of 2 in this idea
You cannot put the whole world on a page
Your study sheet then lists the seven places that lean shows up. The slide show that walked through them was not fully captured in the library. The list in the next step is the study sheet plus the rest of the lesson, not a guessed Apex screen.
Study sheet Q2. If you can explain each of these in one sentence, you can do that question.
Click a diagram to open it bigger.
Learn the seven: projection, symbols, coloring, shading, labeling/text boxes, lines, centering and orientation.
Lesson 1.3.5 study sheet Q21 of 3 in this idea
Seven ways a map can lean
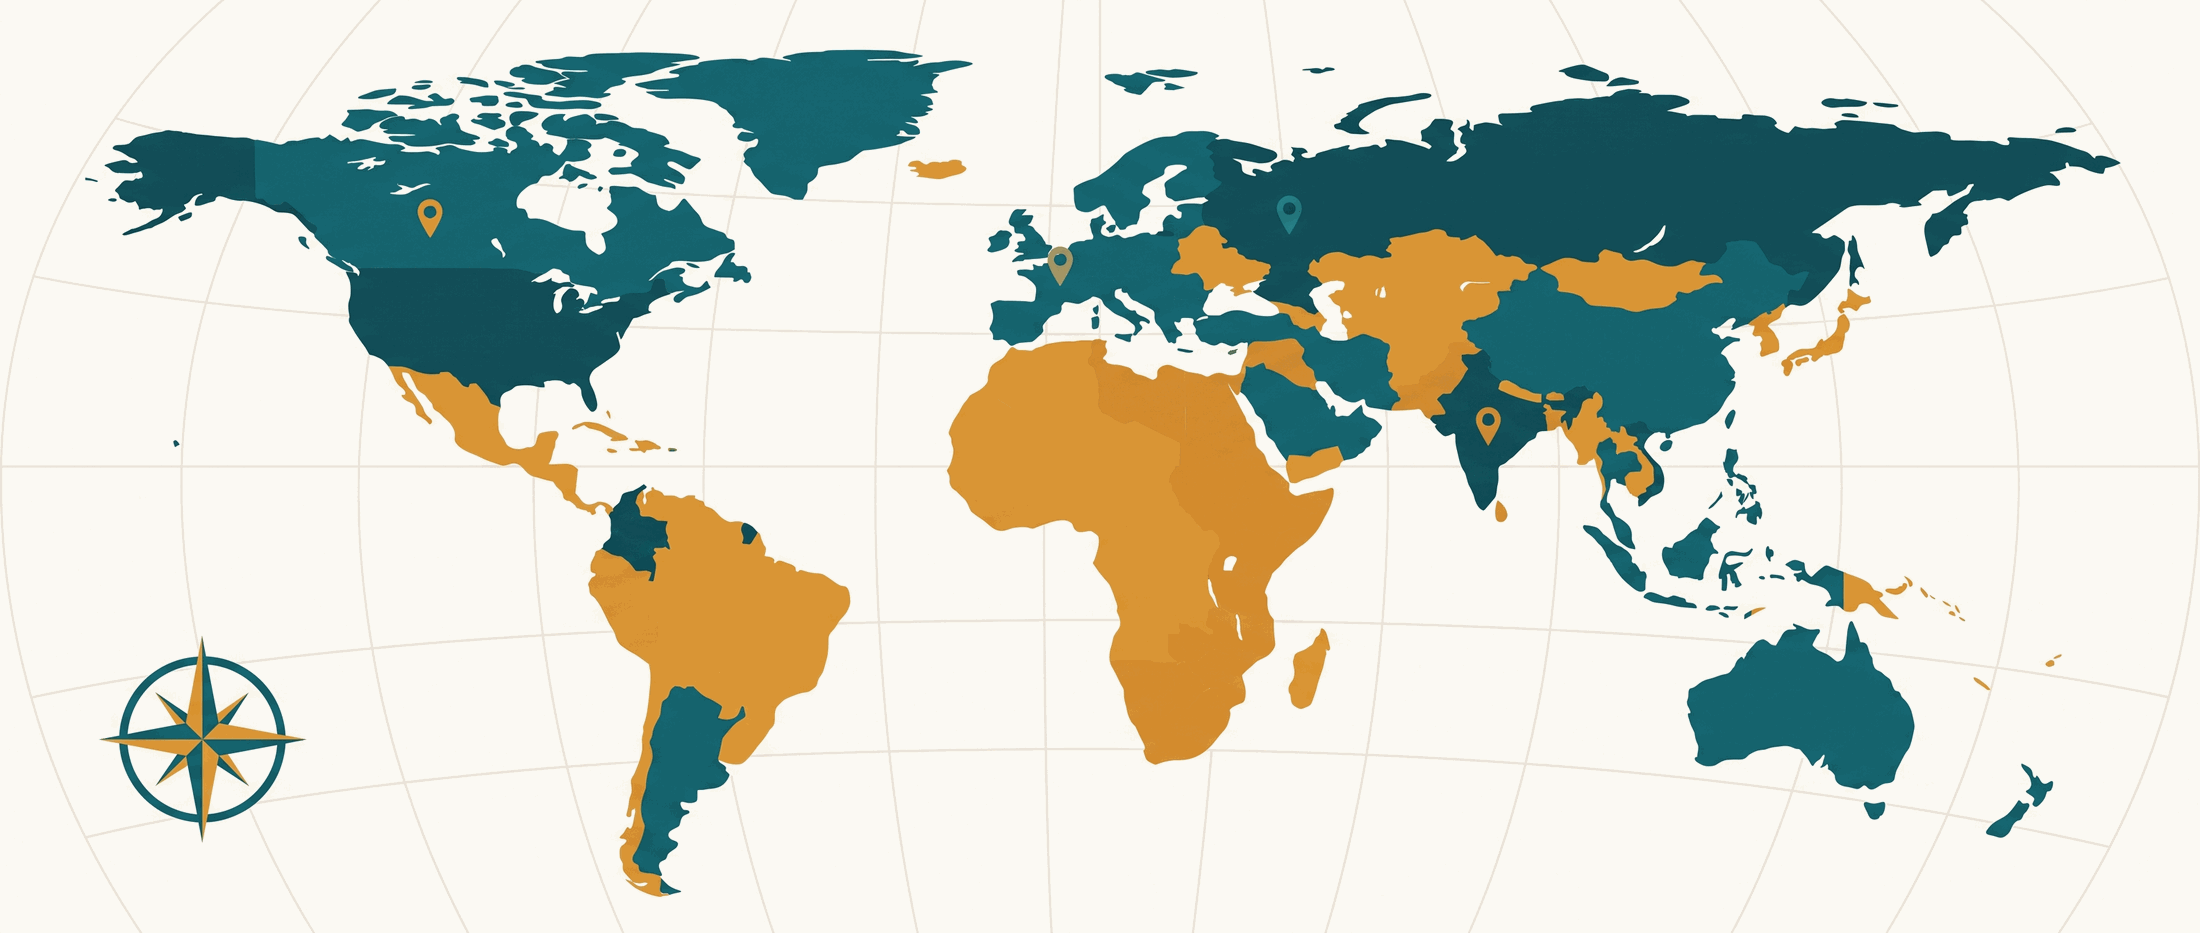
• Projection — flattening the globe. High-latitude countries look huge on some world maps. That is 1.3.1's Greenland/Africa problem, now named as bias. • Symbols — a hospital cross vs a warning skull. Same place, different story. • Coloring — red often reads as danger or as "this side won." Blue reads as calm. The feeling arrives before the legend.
Lesson 1.3.5 study sheet Q22 of 3 in this idea
Seven ways a map can lean
• Shading — darker looks like more. A map that shades one region almost black makes it feel dominant. • Labeling and text boxes — what is named, in what size, and what is left blank. A text box in the upper left gets read first.
Lesson 1.3.5 study sheet Q23 of 3 in this idea
Seven ways a map can lean
• Lines — thick borders look like walls. Thin dashed lines look easy to cross. • Centering and orientation — the center is the part your eye goes to first. The upper-left corner gets the most attention. Most modern maps put north along the top half. That is a habit. A Pacific-centered or south-up map feels "wrong" only because of that habit.
0
For Q2, one concrete sentence per item is enough. Example: "Coloring can make one country look threatening if it is painted alarming red."
Not sure about this bit?
Seven items on the study sheet. One plain sentence each and you can answer the question.
1
Projection
How you flatten the ball. Greenland looking as big as Africa is this one.
2
Symbols, color, shading
Icons, mood colors, and dark meaning "more." Feelings can arrive before you read the legend.
3
Labels, lines, center
What you name, how thick a border is, and what sits in the middle. The upper-left corner gets read first. Putting north at the top is a habit, not a law.
Quick check — answer out loud before you peek
Name any three of the seven bias sources.
Any three of: projection, symbols, coloring, shading, labeling/text boxes, lines, centering and orientation.
When this makes sense, hide it and go back to the lesson.
Lesson 1.3.5 p31 of 2 in this idea
Conventional maps hide the lean
The lesson shows the official world map of the National Geographic Society: the familiar oval world with north up and the Atlantic near the middle. Conventional world maps all look like that. You only notice the bias when you meet an unconventional map.
Lesson 1.3.5 p32 of 2 in this idea
Conventional maps hide the lean
South-up maps, Pacific-centered maps, and maps that put a different continent in the middle are doing the same job with different habits. None of them is "the real" world. Each one is a picture.
0
If a question asks why an unusual world map feels wrong, the course's answer is: conventional maps trained your eye. That feeling is the bias becoming visible.
Lesson 1.3.5 p4–51 of 4 in this idea
Validity means "does it do its job?"
Denis Wood: "A map's quality is a function of its purpose." In plain words: a map is good if it does the job it was made for.
Lesson 1.3.5 p4–52 of 4 in this idea
Validity means "does it do its job?"
The dishwasher analogy: a machine that runs every cycle and then leaves the dishes dirty has failed its job. A world map that will not get you from James Street to Washington Avenue has not failed. Street-finding is not its job. It would only be invalid if it failed to give a view of the world as a whole.
Lesson 1.3.5 p4–53 of 4 in this idea
Validity means "does it do its job?"
Validity is how well something does what it claims to do. Judge a map against its original purpose, not against "includes everything."
Lesson 1.3.5 p4–54 of 4 in this idea
Validity means "does it do its job?"
The 1929 Surrealist Map of the World is the course's check. Is it valid? • Not because it shows true size and location in 1929. • Yes, because its purpose is to represent the way Surrealists viewed the world in 1929. • Not because it is the map we use today. • Not because the United States is missing. That missing U.S. is the point. The maker thought poorly of the United States and put the Pacific in the center. You would not navigate with it. It is still a valid picture of that historical view.
0
Surrealist map: the correct choice is the one about purpose (how Surrealists viewed the world), not accuracy of size. Missing the U.S. is bias, not a reason to call it invalid.
Not sure about this bit?
The Surrealist map looks wrong until you ask what it was for.
1
Ask what the map claimed to do
Show the whole world? Show city streets? Show how one art group in 1929 saw the planet?
2
Then ask if it did that
Missing the United States is a problem for a 2026 atlas. It is the point of the Surrealist map.
Quick check — answer out loud before you peek
Why is the Surrealist map still valid?
Its purpose was to show how Surrealists viewed the world in 1929, not to show true size, and not to be the map we use today.
When this makes sense, hide it and go back to the lesson.
Lesson 1.3.5 study sheet Q31 of 2 in this idea
Plan a map of where you live
This is the study sheet's long question, and it is the lesson in one exercise. You do not have to finish a polished drawing. You do have to make the decisions on purpose.
Lesson 1.3.5 study sheet Q32 of 2 in this idea
Plan a map of where you live
a. What does "where you live" mean: house, street, town, county? b. How much space around it does the map need? c. What goes in, what stays out? A street map leaves out topography. The lesson says: look at a satellite view of the place, then decide what would help and what would confuse. d. What sits at the center? Everything else is defined relative to that. e. Orientation: north at the top, or a tilt? Upper left gets the most attention. f. Scale or no scale? Scaled = better for directions. No scale = relative importance. g. Legend: standard markers, or your own? h. Color, and why. i. Is it valid? Only if it does the job you named in (a). j. Sketch. The point is the decisions, not a final ink drawing.
0
If you write Q3 as a list of those ten choices, you have the question. Validity in (i) should point back at the purpose you picked in (a), not at "looks like Google Maps."
Lesson 1.3.5 p51 of 2 in this idea
Never trust a single map
The lesson ends with a timeline of mapmakers, and then an alternate timeline of the same story with different people included, because of space. Selection is a bias even when nobody is lying.
Lesson 1.3.5 p52 of 2 in this idea
Never trust a single map
Because of bias, never be satisfied with a single source on an important subject. Look for other maps. They will show different leans, and that is the information.
0
"Always look for other sources, which will show different biases" is a line the course wants you to leave with.
That's the lesson
Before you quiz yourself
Check the ones that make sense now. This list is saved in this browser. The other tools (name that term, flashcards, practice quiz) are up top whenever you want them.
Built from Apex 1.3.5 Maps and Map Bias (7 pages) and its study sheet. The "Looking for Bias" slide show and two unconventional-map interactives were not fully captured in the library; those sections are taught from the study-sheet list, the National Geographic / Surrealist examples that did survive, and the 2004 U.S. election maps the lesson names.